
Where We Are: Understanding Current Market Valuations
Everyone wants to know where the market is heading. Will stocks go up or down? Will we have a recession? What should I do with my money?
The reality is that it's impossible to know where we're going. The future is inherently unknowable. Markets are complex systems influenced by countless variables: economic data, geopolitical events, investor psychology, technological change, all interacting in ways that can't be predicted with any reliability. But while we can't know where we're going, we can know where we are right now. We can measure current valuations. We can compare them to history. And we can use that information to understand the risk and opportunity in front of us.
So where are we today?
The Valuation Picture
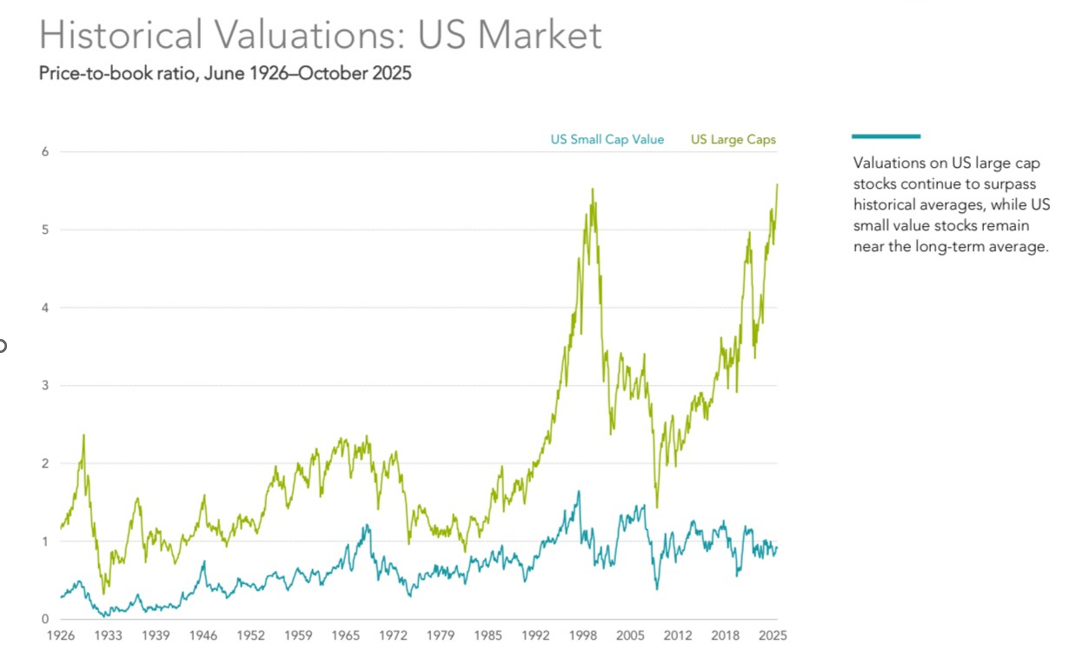
This chart shows price-to-book ratios for different segments of the U.S. market going back to 1926. The green line represents large cap stocks, the companies that dominate market indices: Apple, Microsoft, Nvidia, and other technology giants.
These stocks are currently trading at approximately 5.5 times book value. We've only seen valuations at this level once before in the past century: 1999, at the peak of the dot-com bubble. For most of market history, large caps have traded well below these levels. Today we're back at 1999 extremes.
Meanwhile, small cap value stocks (the blue line), companies trading at more modest valuations, remain near their long-term historical averages around 1x book value. They're trading at roughly the same valuations they've held for decades.
The valuation gap between expensive stocks and reasonably priced stocks has never been wider.
What This Means for Index Fund Investors
This matters particularly if you're investing through broad market index funds. Index funds are constructed by weighting companies according to their market capitalisation, their total stock market value. This means the largest companies receive the largest allocation in the index. It's a simple, transparent methodology.
But it has an important implication: when the largest companies happen to be expensive (as they are today), your index fund becomes heavily concentrated in stocks trading at historically high valuations.
You're not buying "the market" in some neutral sense. You're buying a portfolio that's tilted towards the most expensive stocks, at a time when those stocks are at valuation levels we've only seen once before.
From 2010 to 2021, this worked spectacularly well. Large growth stocks got more expensive, and index fund investors did very well. But that performance was driven largely by multiple expansion, investors paying higher and higher prices for the same earnings, rather than by fundamental business growth alone. The question is whether that can continue from current levels.
Why Understanding Where We Are Matters
I can't tell you what will happen over the next year, or the next five years. Nobody can. But I can tell you that we're at valuation levels that have only occurred once before in modern market history. And the last time we were at these levels, in 1999, it didn't end well for investors in expensive growth stocks.
Does that mean history will repeat exactly? No. Markets never repeat exactly. But they often rhyme.
In my next article, I'll show you what actually happened the last time we were at these valuation levels. The performance differences between expensive stocks and reasonably priced stocks were significant, and they're worth understanding as we think about positioning today.
For now, the key point is this: we can't know where we're going. But we can, and should, know where we are.
And where we are is at valuation levels that historically have preceded challenging periods for growth stock investors.